Any Online Marketing action that you want to complement has to be TRACKED, MEASURED to be able to know its performance, its effectiveness.
Besides, knowing the behavior of users is fundamental to make decisions based on data. In this way, you will be able to improve your digital marketing strategy.
Get this in your head:
THE DATA ARE GOLD IN POWDER. It’s all about tracking and testing.
Having said that, accompany me to go through this guide in which I tell you how to create an account in Google Analytics, how to install it on your website and what are the basic metrics of this tool, among other very important issues like the ones you are going to read now.
Let’s start by the beginning,
What is Digital Analytics?
Digital Analytics is the science that deals with the “quantitative (quantity) and qualitative data (quality) analysis of your website and competition that motivates the continuous improvement of the online experience of your current and potential customers, so that this is translated in achieving your goals (online and offline)”. (Avinash Kaushik)
Besides, we must take into account these TIPS that we share the specialist in Digital Marketing, Nico Roddz and its Google Analytics course in the Linkedin learning platform:
- Without goals or action, it is nothing more than to report.
- Do not forget that the Internet is the most measurable channel.
- Analysis and interpretation of data: good questions lead to good optimizations
What are metrics and KPIs in Google Analytics?
Metrics and KPIs are two concepts that you have to have very clear. It is very simple. In the first case, it is about numbers or percentages that tell you what is happening on your site. Not all the metrics at the same.
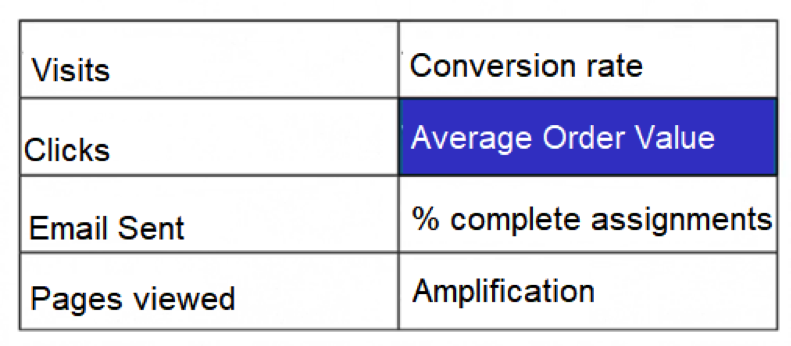
If you had an e-commerce store, which of these metrics do you think would be the most important? Undoubtedly, the AVERAGE VALUE OF ORDER: how much each customer spends on average when making a purchase.
KPIs (Key Performance Indicators – key performance indicator or management indicators) have the function of telling us whether we are meeting our goals or not.
That is to say, standard metrics only serve to know QUANTITIES (visits, clicks, sent emails, page views, etc.); KPIs are closely related to a profitability objective.
Although there are general KPIs, each project must construct its own indicators that allow it to determine the effectiveness grade of its actions.
Google Analytics key concepts you need to know before creating an account
- Dimensions in Google Analytics: characteristics or attributes of the user or a session. ARE NOT METRICS. Examples: the type of browser, the country the user came from, how he arrived (the traffic source), the keyword he used, etc. These dimensions will help you segment information. Remember this: dimensions + metric is equal to SEGMENTS.
- Events in Google Analytics: are the interactions that Google Analytics does not measure by default. That is, what he does not see. They may be clicks on buttons, forms without thank-you page, video plays, and so on. If you apply the “Events” tracking, you’ll be able to fine-tune, for example, your “rebound” percentage (users who enter your website, scroll, click a button or download something and leave). How to implement it? The most effective is Google Tag Manager (but you will have to train a little in its operation).
- Segments in Google Analytics: It is about grouping the data by common patterns or characteristics with the aim of understanding them better. Some examples: segmentation by Geography, Marketing channel, by type of customer (what pages they visit, what products they buy, etc.). Segmenting is looking at the data with LUPA.
- Goals and conversions: What is your website for? To sell products (e-commerce store) or to generate contacts (prospecting)? All this has to do with the PURPOSE. There are many other objectives. You decide what your site is for on the Internet. Now let’s see the CONVERSION. Simple: is to turn the visit into what we have defined in the Objective. If we want to sell a product, we need to convert a visit to a BUYER.
To close this section, it is necessary to indicate that you will have to configure Google Analytics based on your conversion target and based on the reason for your website (GENERAL PURPOSE). You know what? If you have not already determined, think about it!
How to create an account in Google Analytics?
It is a very easy process. You just only have to have an email account and a website, and then:
- Get in www.google.com/analytics
- If you already have an account, just login. Otherwise, click on “Create an account”.
- The system will ask you to register and you will request personal data and the website.
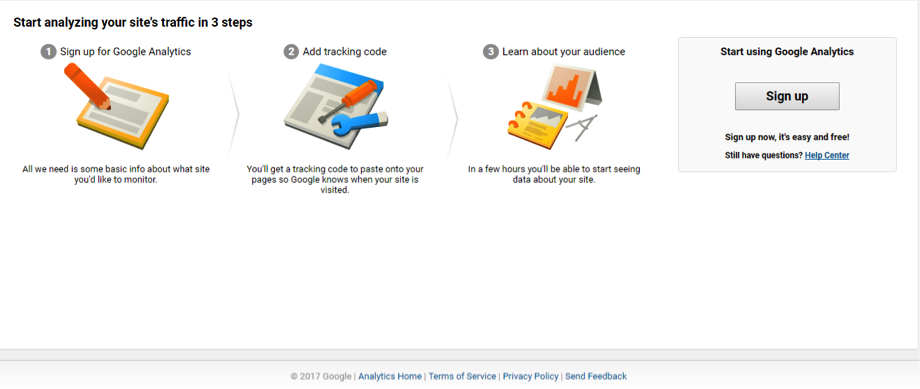
- You can only track those websites that control the HTML code. This means that you cannot access data from another website other than yours.
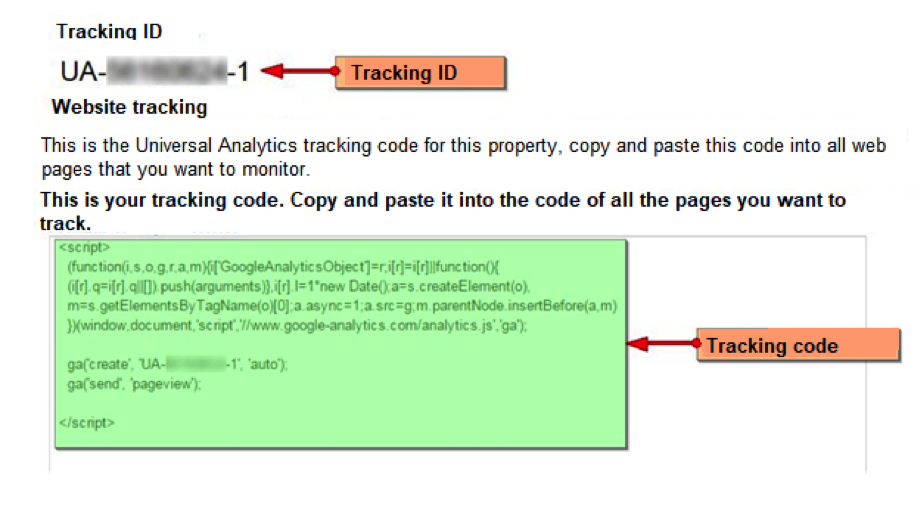
- Once you have completed all the fields, click on the “Get Tracking ID” button and you’re done. You already have your Google Analytics account.
This tracking ID has to do with how this tool works: cookies. Does it ring you? These are files that are stored in the user’s browser and stores information. The Google Analytics tracking code then sends it to your servers for processing.
The tracking code is the one you have to integrate into your website. We’ll explain it to you right now…
How to install Google Analytics?
This step is the one that allows you to validate that you are the owner of the site that you entered in the previous step. Of course, it enables you to start receiving data.
How to do it? You’ll have to copy the tracking code (which you’ll see once you’ve created an account in Google Analytics) on every page of your website.
If you have a programmer who takes care of your website, he will know how to do your process. Otherwise, you need to know that most platforms (like WordPress) have plugins or modules that allow you to automatically install Google Analytics.
Now it’s time to explore the tool. It has many options. There is no other alternative than to try and support you in online resources (tutorials, guides like this, videos, etc.).
TIP: IT IS IMPORTANT THAT YOU EXCLUDE FROM GOOGLE ANALYTICS DATA COLLECTION. Many times, people on your team or yourself are permanently entering the site. All those actions that you do are going to be stored by Google. You have to avoid the data from getting “dirty”.
What are the basic Google Analytics metrics?
1. – VIEW PAGES
Refers to the total number of pages loaded during a session (since the user entered the site until the time it left).
Suppose a user places it on the Google search engine: how to advertise on the internet.

The first ad is on Facebook. Suppose the user enters the site. At that moment the session begins. Load about 6 pages with the information that interests you and leaves. The session ends.
The “page view” metric counts just that number: the six pages you saw during the session.
ATTENTION: Analytics also counts the pages loaded (when the user “refreshes” the same page) and displays it as such. What you can do is not count them in your report.
The interpretation of this data is quite simple: the greater number of page views, the greater interaction of users with your website. It is a positive info.
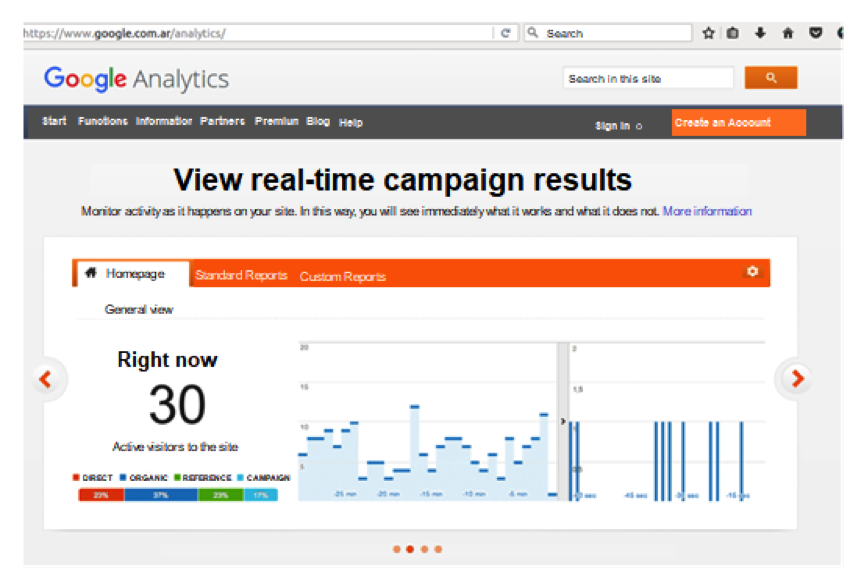
2. – VISITS / SESSIONS
I have already spoken about what a SESSION is in terms of the moment it begins the moment it ends. But what does the user do during the duration of a session? It carries out other actions besides viewing pages of the site. All this set of interactions are within the term SESSION.
Possible interactions: transactions, the average time of session duration, pages you visit, abandonment and any other event that you have configured.
Keep in mind that the session is automatically renewed every 30 minutes (you can change this configuration), at midnight and depending on the campaigns from which the user arrives (if it comes from an Adwords campaign, spend 30 minutes, the session is renewed and the user returns to the site through another campaign, two sessions are counted).
3. – TIME ON THE SITE
This metric is also very important. I said it before, but I repeat it now: measures a user’s interaction time with your website.
How do you make it as accurate as possible? Customizing the tool. There are two ways to set up analytics:
- With the option “No interaction on the last page”. Let’s take an example: a user looks for the following: watermark in photos. Enter the first result of Google in the time of 21:00 hs. At 21.05 visit another site and at 21:10 load a last page. The watch will be cut on that last page you visit. The time on the site will be 10 minutes. The time on the site will be 10 minutes. But, we will not know how long it was on that last page. Lack of accuracy.
- With the option “With interaction on the last page”. Putting the same example above and assuming that the user entered the site at 21.00 and visited the last page at 21:10, but stayed until 21.15 pm. Session time includes everything the user did: the watch is cut off only when there is inactivity. This option is much more accurate.
4. – BOUNCE PERCENTAGE
It’s one of the metrics that scares: is the percentage of users who come to your site, but who only make a single interaction and leave. That is the only interaction loading the page to which they entered.
If of 100 sessions, 50 users bounce, you have a 50% rebound percentage (100 – 50). How to interpret this data? It is only in the context. Because is not so simple.
Google Analytics does not take interactions like scrolling, comments that were left, visualization of videos, etc. Do you remember the Events category? Just for that serves the configuration of events. To counteract these actions are invisible to Google Analytics.
This does not mean that there are no rebounds. A user who comes to a site and leaves has his reasons. It could be because of a bad ad, bad experience, irrelevant traffic, etc.
5. – SINGLE VISITORS
The “unique visitors” metric refers to the unique number of non-duplicate users.
Let’s go back to cookies to understand this metric. I said that they are files that are stored in the user’s browser in order to store the information. What identifies Google as a person is a cookie, a file.
Each user is a unique cookie. What about this? That volume of unique users is always greater than what is actually. The reason is simple: if you upload the same site in three different browsers, there are three unique users for Google Analytics when in fact it is only one.
The technology advances, so there are already some ways to reduce this margin of error. But that is a topic that you will have to see later when you continue to advance in terms of your knowledge about Google Analytics.
This guide ends here. I think it’s a good way to start exploring one of the fundamental tools to improve your entire digital marketing strategy. Without data, nothing is possible.
Hope it has served you. If you have comments, suggestions, questions, we await your words. Thank you so much for having come here!