Social Networking statistics exist so you can learn how effective your performance on Social Media is. Analyzing said data is the best way of knowing if you are reaching your goals in terms of digital marketing, or if it’s time to make a change in your strategy. That’s why today I’ll share with you some information about which Social Networking statistics a Community Manager should know to read. Here we go!
Social Networking Statistics: which are the most important?

Like we said before, Social Networking statistics are incredibly useful: they allow you to know if you are effectively reaching your audience and help you choose the best type of content to share. Now, each of your social accounts includes their own metrics and it’s necessary that you know which are the most important for measuring the success of your campaigns. Therefore, below I’ll share the determinant metrics of each Social Network.
Facebook Insights
The statistics on Facebook are known as Facebook Insights, and you can find them in the bar located in the top part of your Fan Page, as shown in the following image. To view it you must be an administrator of the page.
Among the data that Facebook Insights offers you includes metrics corresponding to each of your posts, followers and the reach that every one of your publications achieved. Likewise, you can establish a list of pages for which you’d like to receive analytics. The main parameters you must address in relation to Facebook Insights are:
- Reach: indicates how many people have seen your publication.
- Comments: signifies how many comments your post has received.
- Likes: shows the number of people who liked your publication.
- Clicks on publications: indicates how many times users have clicked on your posts, disregarding likes and shares.
- Times it was shared: shows the number of times that your post was shared.
Statistics on Twitter
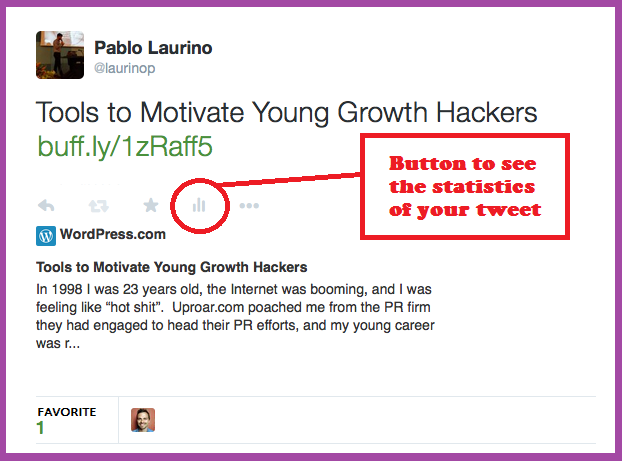
You can see your statistics on Twitter through Twitter Analytics. There, you have the possibility to obtain information on the performance of your account over the past 28 days. Among the very interesting data that this service offers includes the number of impressions of each of your tweets which reveals the effective reach that each of your posts had in terms of users. Likewise, Twitter offers you the opportunity to view individual statistics of every publication. To do this you simply have to press the analytics icon available in each post, as displayed in the image below.
For more information, you can consult our new article on how to use Twitter. As for the most important metrics that this Social Network provides you, they are as follows:
- Retweets: indicates how many times people have shared your publication.
- Favorites: signifies the number of times in which people have marked your tweet as a favorite.
- Replies: shows how many responses your post has received.
Statistics on LinkedIn
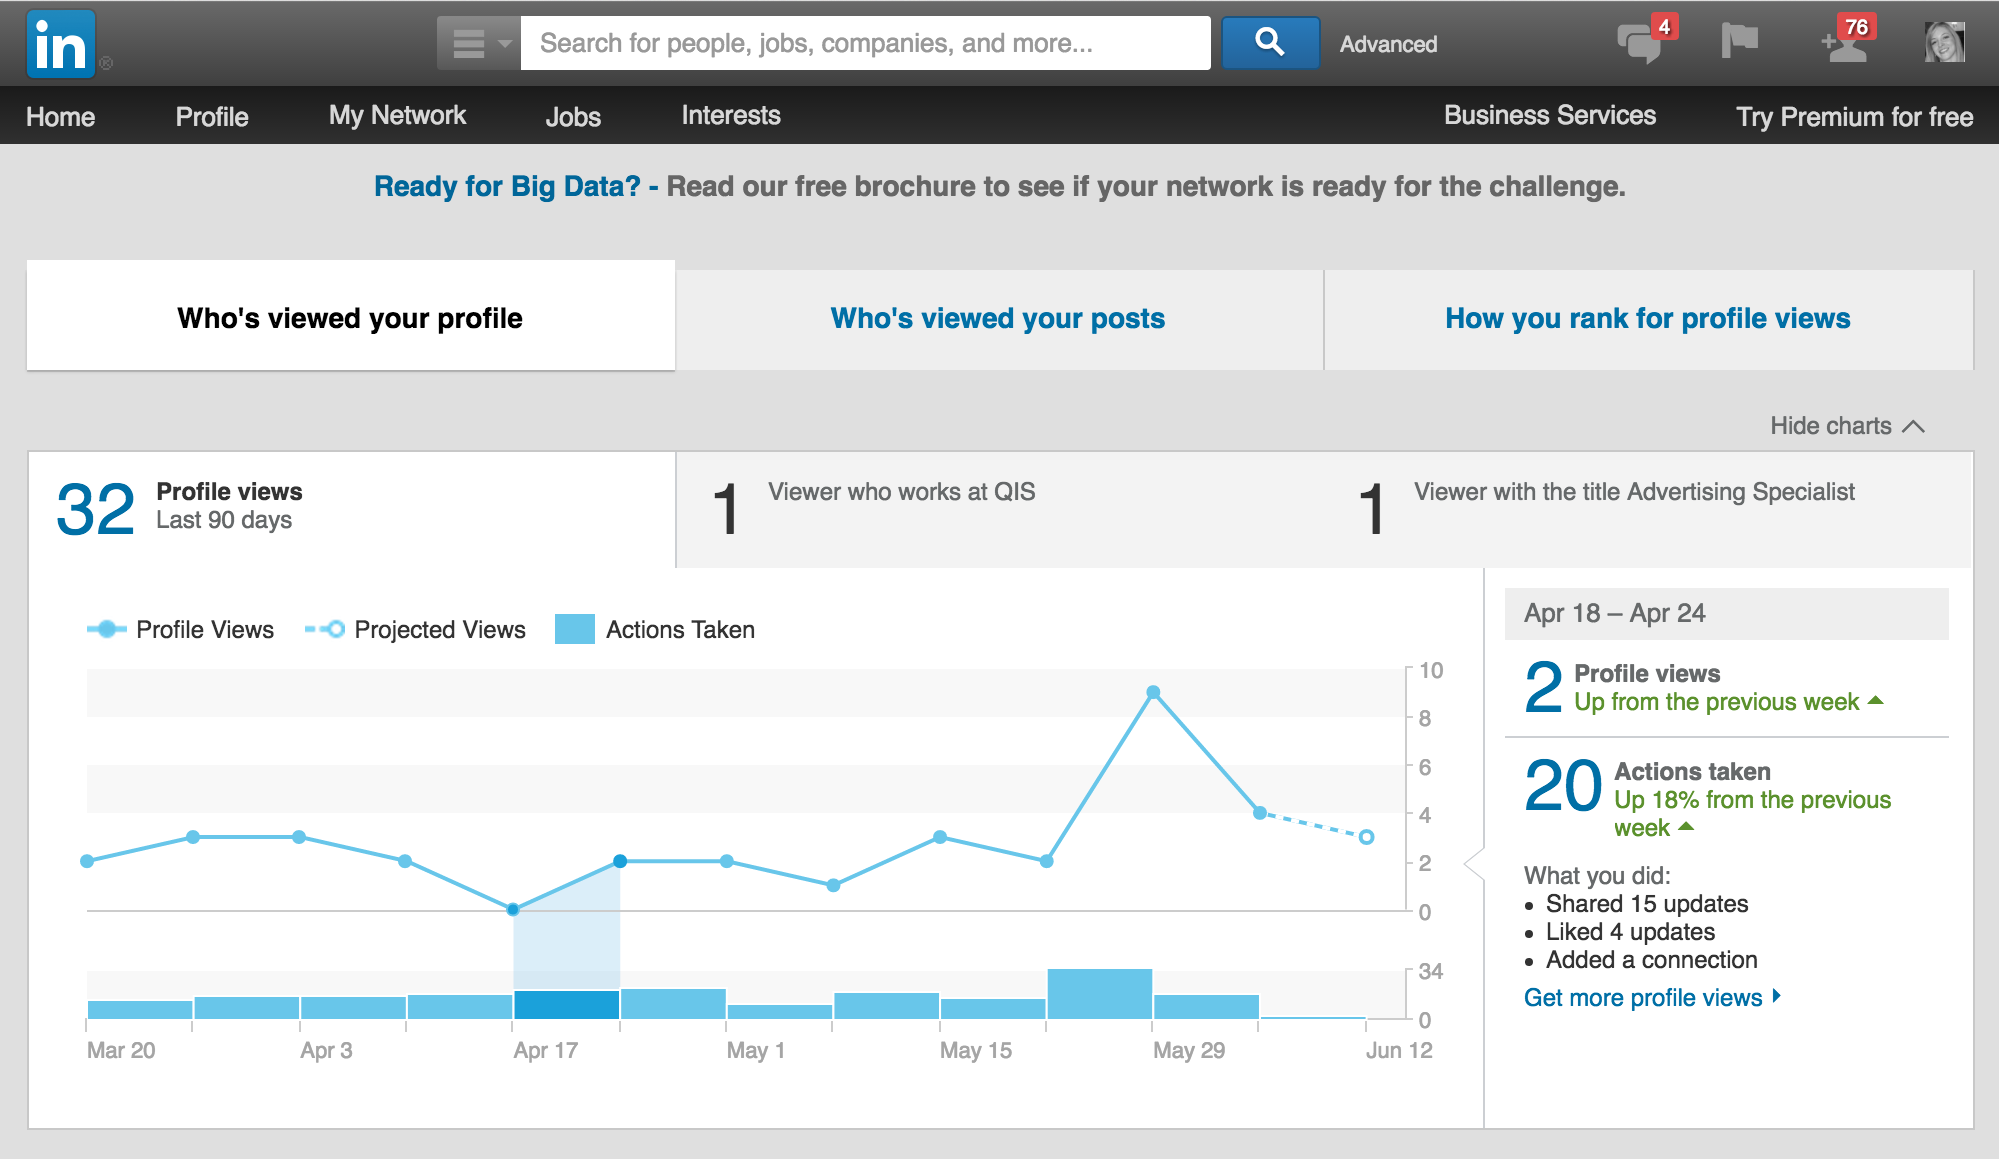
In terms of Social Networking statistics, the metrics on LinkedIn are among the most relevant being as it’s a Social Network fully dedicated to the labor and business world. Thus, in order to discover the data on the performance of your individual accounts, all you have to do is turn to the “Who has seen your profile” option in the “Profile” tab within the site, as shown in the following image.
The main metrics LinkedIn offers you or your individual profile are:
- Profile Views: shows the number of times that people have viewed your profile in the past 90 days.
- Actions Taken: indicates the number of times in which you’ve generated interactions (comments, recommendations or Likes and times that you’ve added new contacts).
- Information on those who visited your profile: signifies how many people with detailed job positions have visited your profile.
Likewise, on LinkedIn you can see the statistics of your Company Page. To find out you only have to log on to your Page and click on the “Analysis” tab, as shown in the image below.
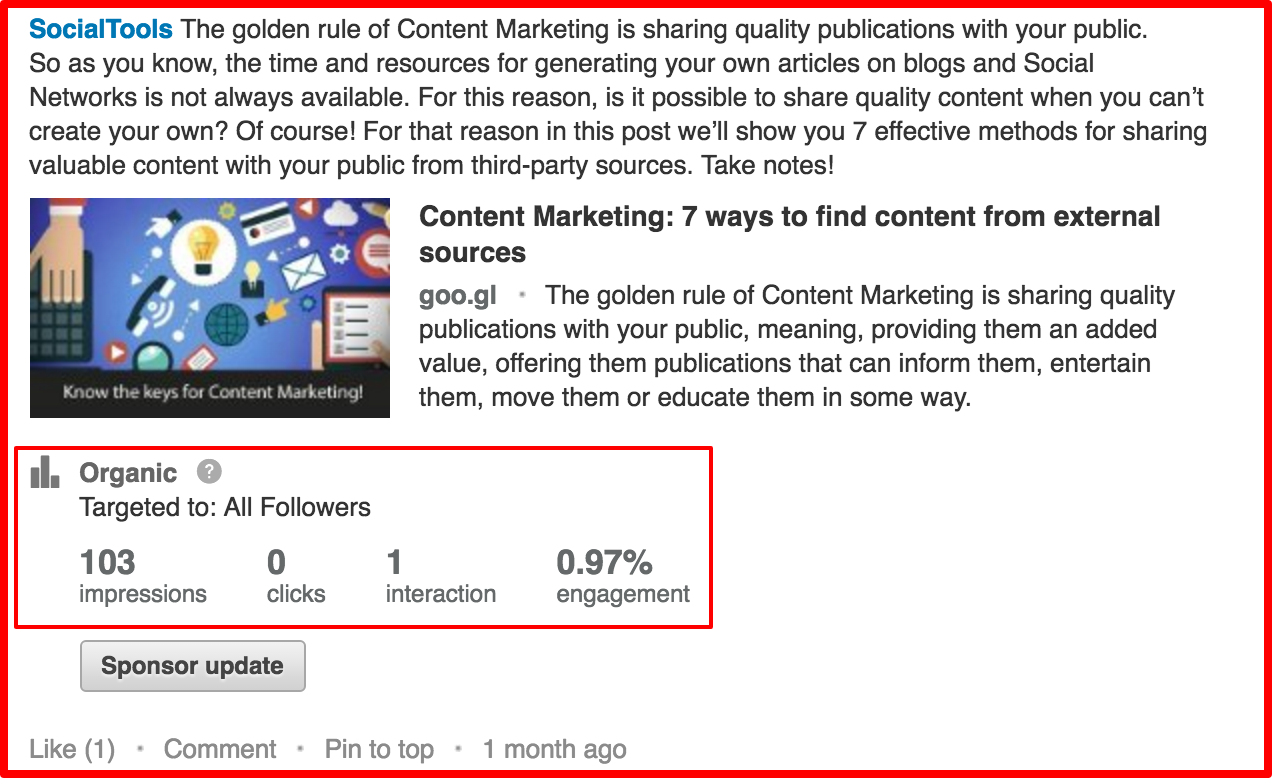
After logging on, you’ll find every one of the posts that you’ve ever shared and their corresponding statistics, as you can see in the screenshot below.
The metrics that LinkedIn offers you for each post on your company page are:
- Impressions: shows the amount of times that your post has been viewed.
- Clicks: indicates the number of times that users have clicked on your company’s content, name or logo.
- Interactions: exhibits how many comments, recommendations and time in which your post has been shared.
- Participation: shows the number of interactions added with the number of clicks, divided by the number of impressions the post received.
Statistics on Google+
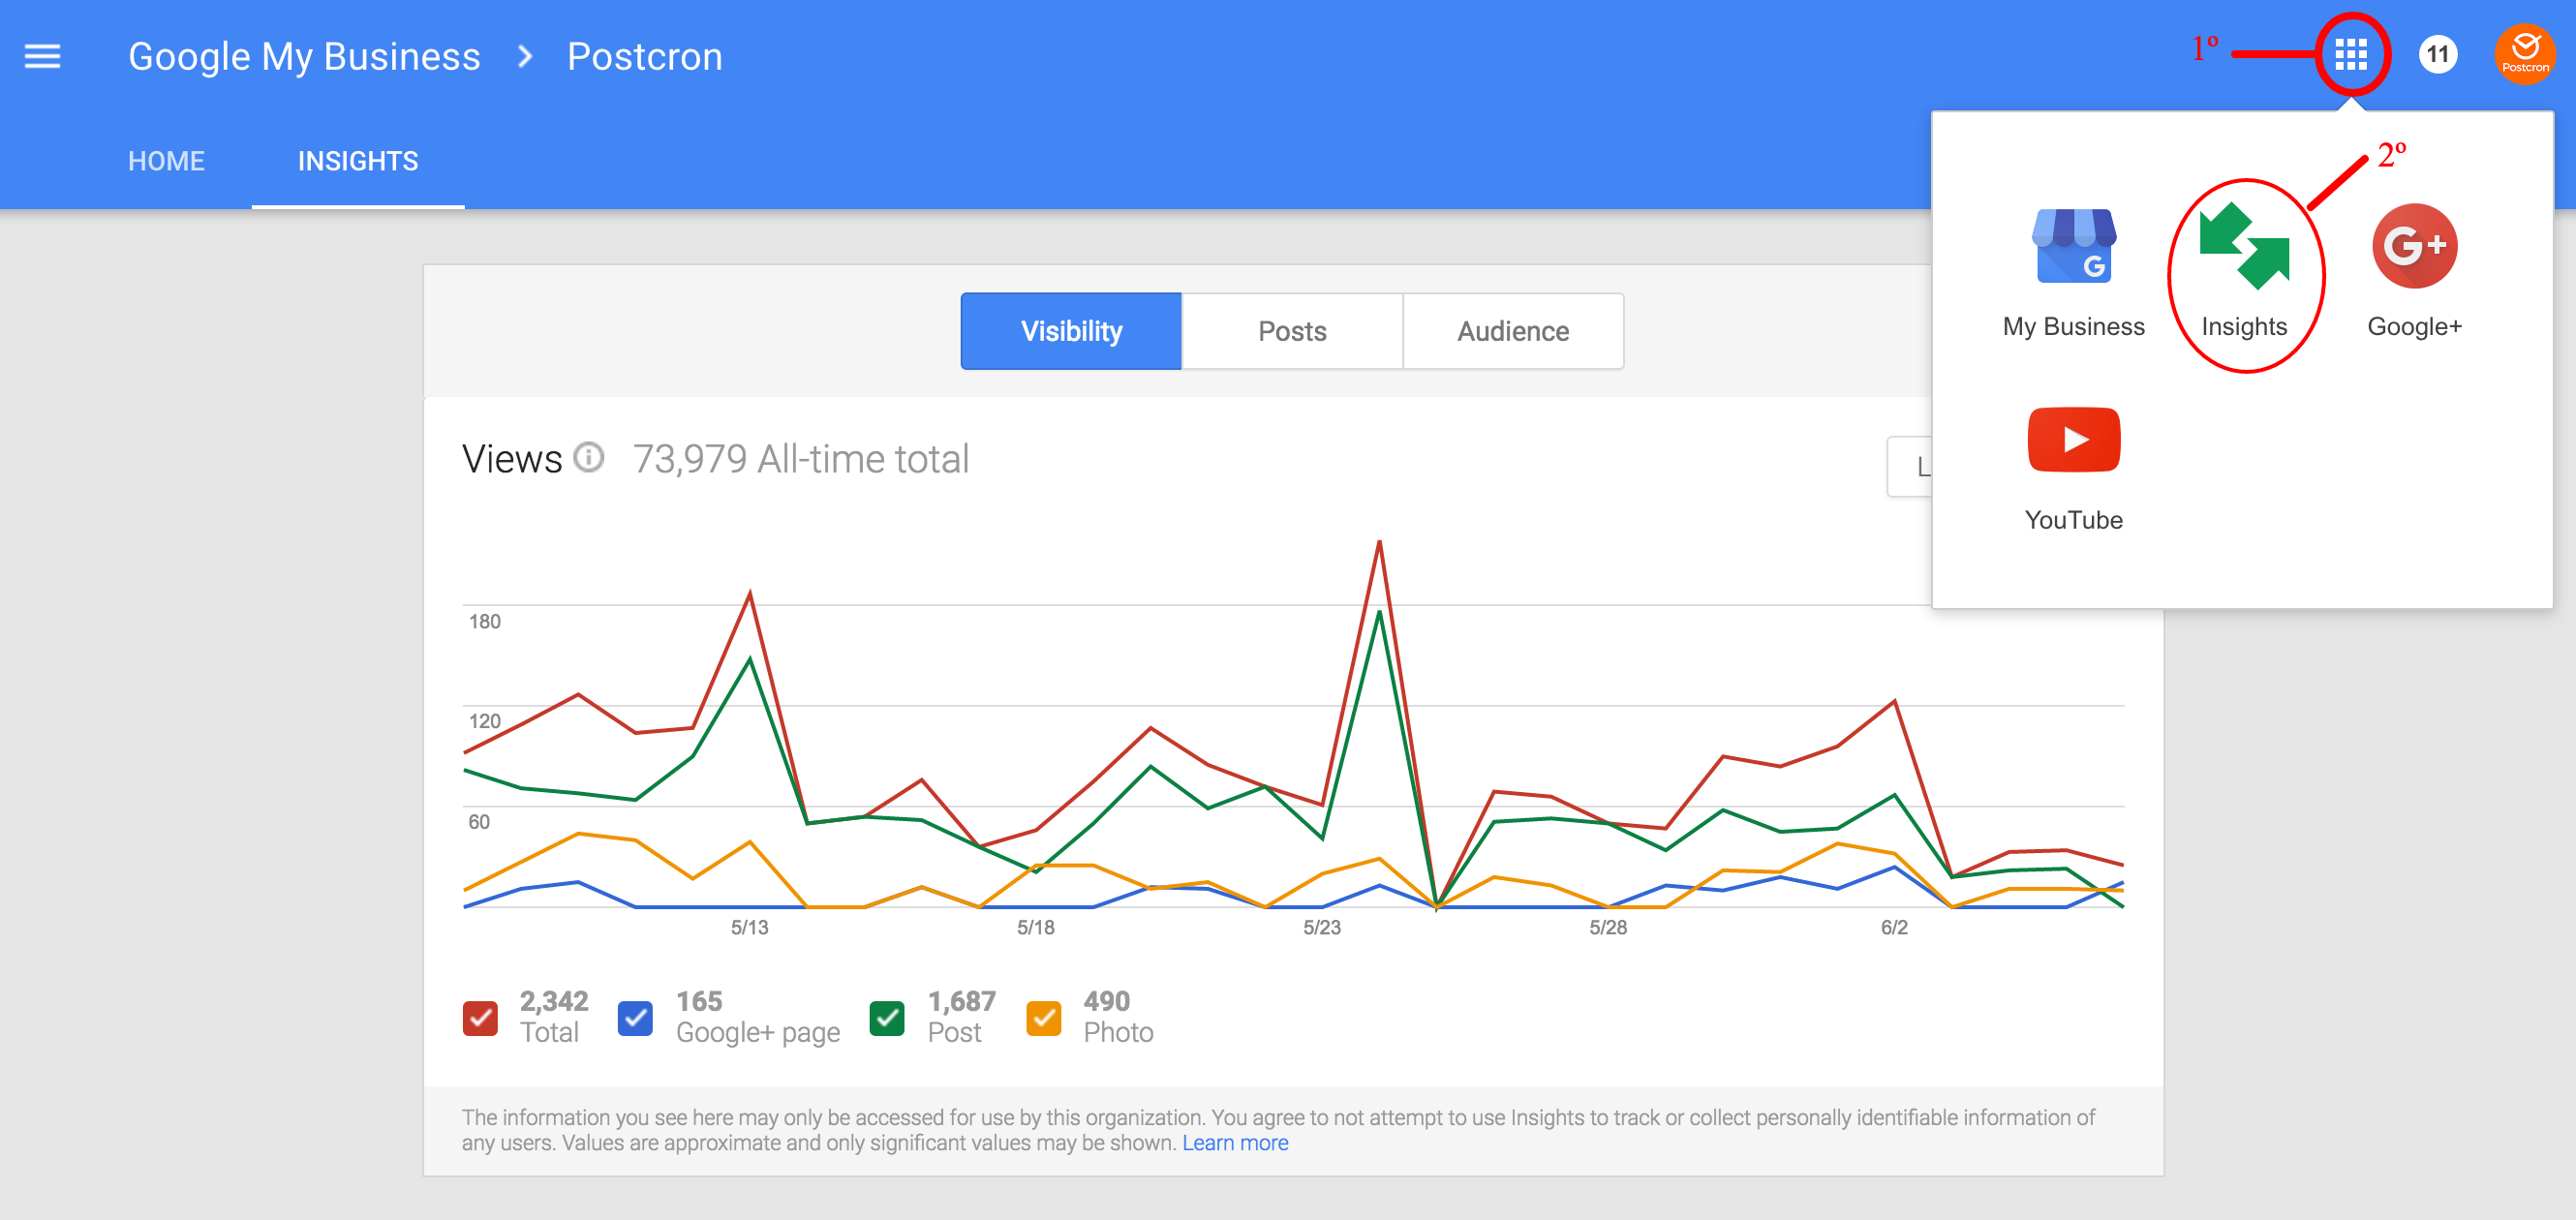
Another one of the social networking statistics that can’t be missing from this list are those that Google Plus offers. In order to access the analytics of your Google Plus page you have to go to the menu located on the right of your page and click the “Insight” option. Then you’ll see a welcome announcement appear and at last you’ll access the statistics panel which is shown below.
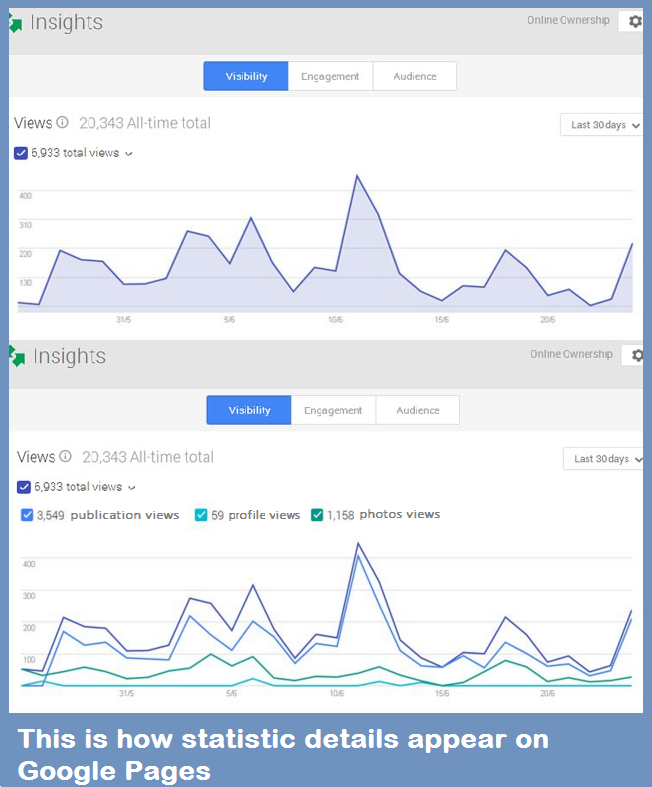
As you may have noticed, in a single panel you can obtain the metrics of your Google+ Page, YouTube channel (if you have one) and Google Analytics, in case you have an account on said service. To learn in more detail about the statistics of your Google+ Page you have to press the “See Statistics” button which is to the right of the first box displayed in the previous image, titled “Statistics”. You’ll be able to view the metrics of your Google+ Page in more detail, as shown below.
The metrics Google+ offers you in regards to your page are as follows:
- Visibility: shows the total number of visits to your page. By clicking on the drop down arrow next to the title “6,933 total views” (in our example) you’ll be able to see the views of your profile, photos and publications in detail.
- Engagement: exhibits the indicators “Publication actions” (clicks, +1s received, comments and times that your post has been shared), “Recent publications” (exhibits your past 5 updates) and “Average actions by publication type” (shows interaction, +1 and comments on your links, photos, texts and videos). To see all these data, you have to press on the “Engagement” button located next to the “Visibility” button that is shown in the image above.
- Public: this parameter displays your new followers and provides you data related to your audience that you can filter by country, age and sex. This characteristic is only activated once your Google+ page receive more than 200 followers.
Statistics on Pinterest
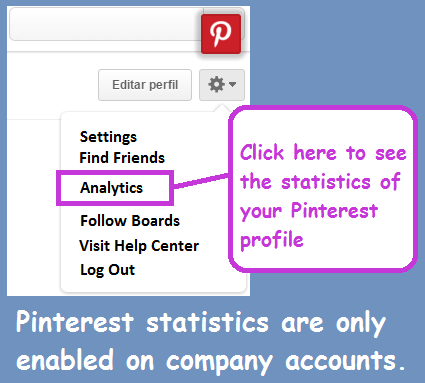
As for Pinterest, only the people who have business accounts can access the statistics. In order to find out what they are you have to go to the settings menu in your profile, as shown in the image below, and then you can select the “Analytics” option.
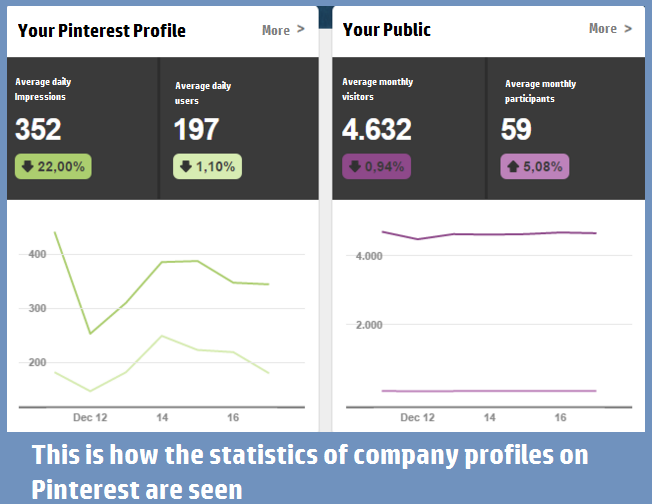
Following you’ll see the General Statistics panel appear in which you’ll obtain a panning of the status of your account in the form of graphs, as you can see in the image below. Additionally, you’ll be able to establish what time period in your account’s development you’d like to analyze in order to find out what the successful peeks are or inactivity in relation to your publications.
The most important panels for analyzing your Pinterest account are the following:
- Your Pinterest profile: here you’ll find the amount of times that your profile has been visited and how many clicks the links to your sites have received, among other data.
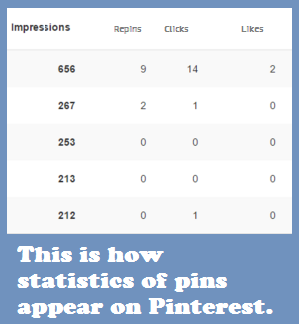
- Your most viewed Pins: shows you the quantity of interactions your pins received, as displayed in the image below. Here you can see the number of impressions, repins, clicks and Likes that each of your posts have received.
- Your Public: this is another important Pinterest Analytics panel since it shows you data about your audience which allows you to get to know them better, and then in turn orient your strategy and choose your content with better efficiency. Some of the data you’ll find are age, sex, interests and the origins of your public.
As you may have been able to notice, social networking statistics have more and more relevance in terms of digital marketing, reason for which I advise you to frequently review the metrics of your accounts. This will allow you to measure your efforts on Social Media and know how close you are to completing your goals.
Did you like this article? What Social Networking statistic services were most useful to you? Tell us your experience! And please, remember to share this blog post with your contacts. See you next time!
